Analytics & Reporting
Data-Driven Workforce Decisions
Interactive dashboards with real-time insights that help you understand workforce trends, optimize resource allocation, and make informed HR decisions.
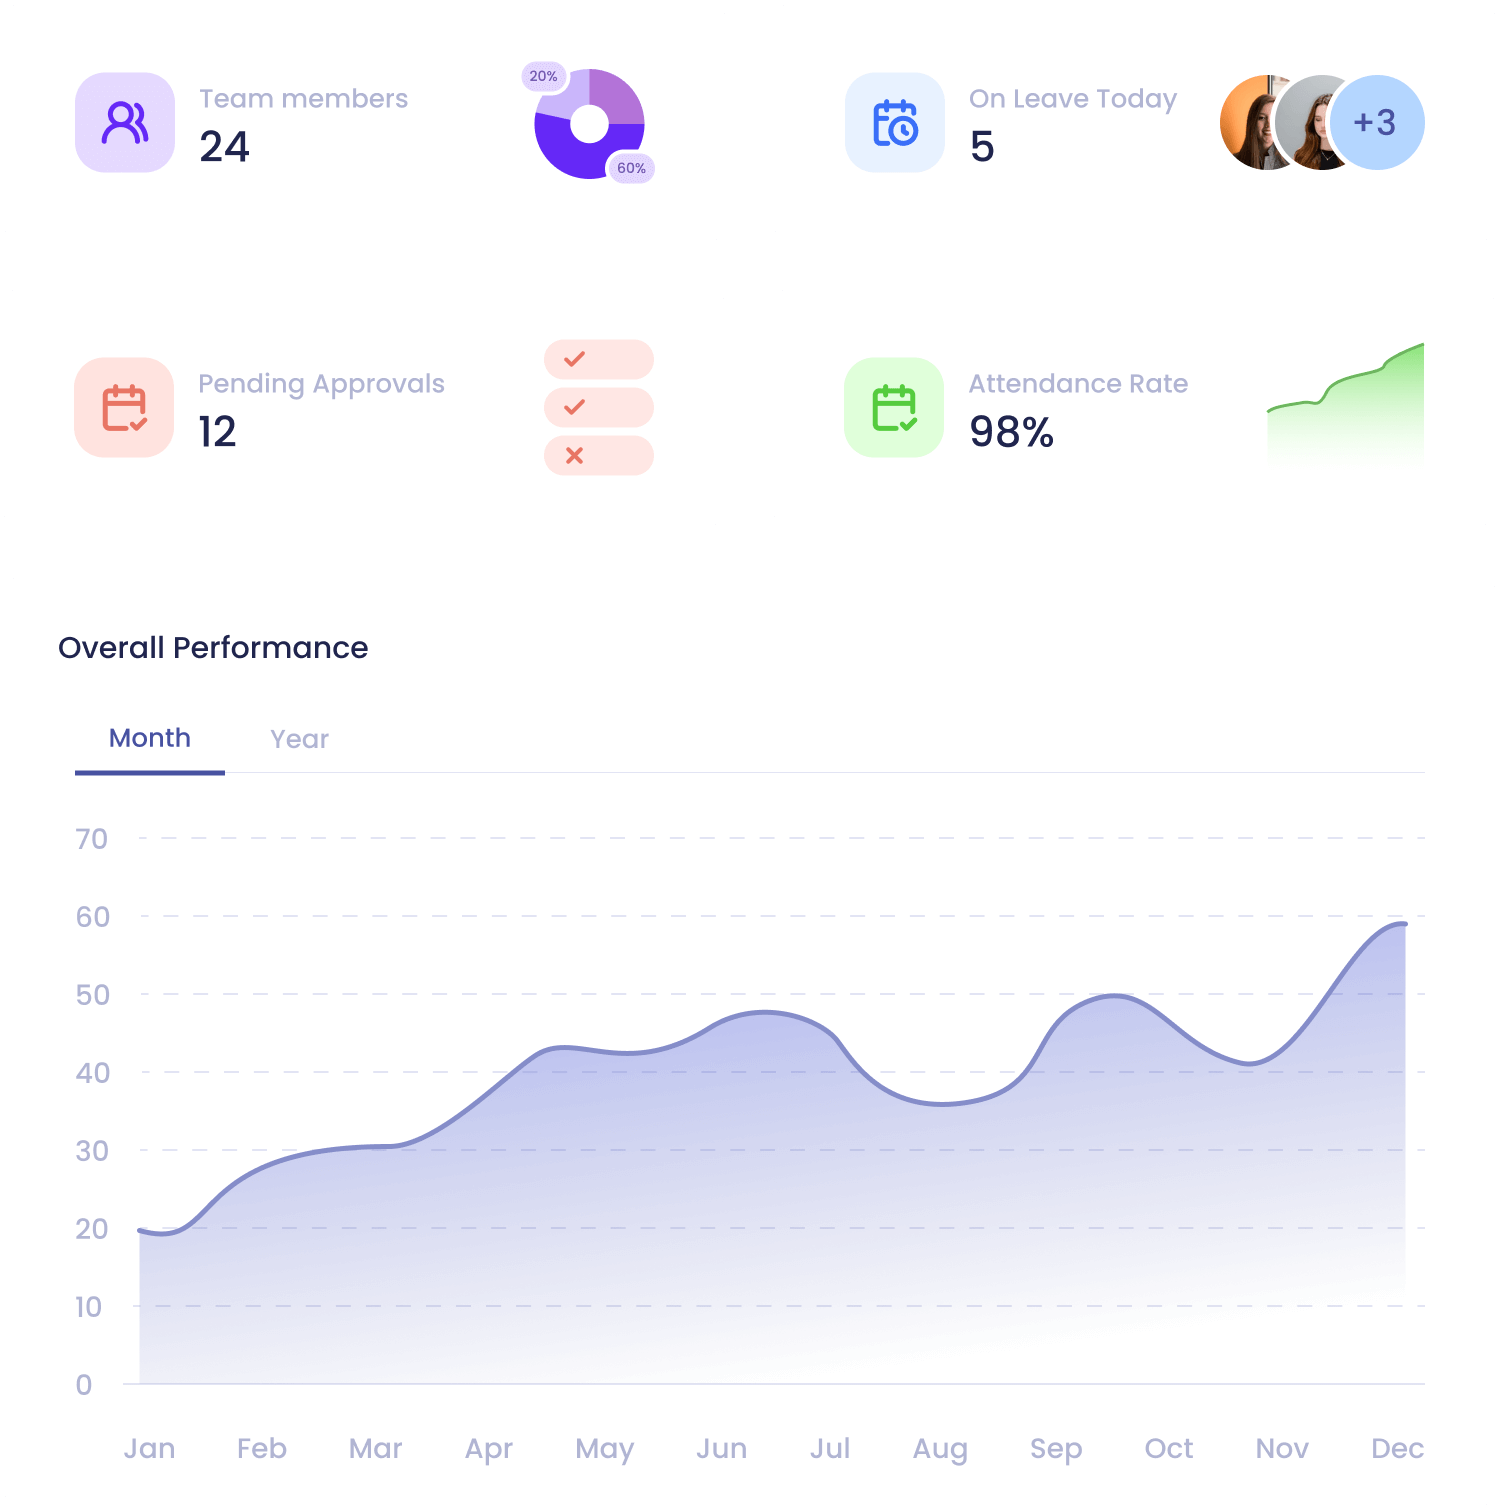
Workforce Overview
Get a bird's-eye view of your entire workforce with comprehensive headcount metrics and interactive visualizations.
- Real-time headcount metrics with trend indicators
- Employee distribution charts by department, location, and category
- Key metrics cards for quick organizational health checks
- Global filters by department, location, and employee category
Demographics & Tenure
Understand the composition of your workforce with detailed demographic breakdowns and tenure analysis.
- Age and gender distribution visualizations
- Tenure progression analysis across the organization
- Education level breakdown by department and role
- Designation and role distribution insights
Department & Location Insights
Compare performance and composition across departments and locations to identify patterns and opportunities.
- Side-by-side department comparisons with key metrics
- Headcount trends by department over time
- Location distribution with geographic visualizations
- Remote vs office ratios and hybrid work analytics
Leave Analytics
Analyze leave patterns across your organization to optimize policies and ensure adequate coverage.
- Leave usage trends over time with seasonal patterns
- Department-level leave patterns and comparisons
- Balance analysis by leave type and employee group
- Utilization breakdown to identify policy improvements

Employee Lifecycle
Track the complete employee journey from hiring to separation with actionable lifecycle analytics.
- Hiring trends with joiner analysis by period and source
- Separation and attrition analysis with reason breakdowns
- Tenure progression tracking across departments
- Lifecycle stage distribution for workforce planning